Author: MindFlux

  • Crown shyness: why some tree crowns never touch

    Crown shyness: why some tree crowns never touch

    Crown shyness canopy pattern in a forest, seen from below
    “River of Blue,” photograph by Charles Chandler, CC BY-SA 4.0.

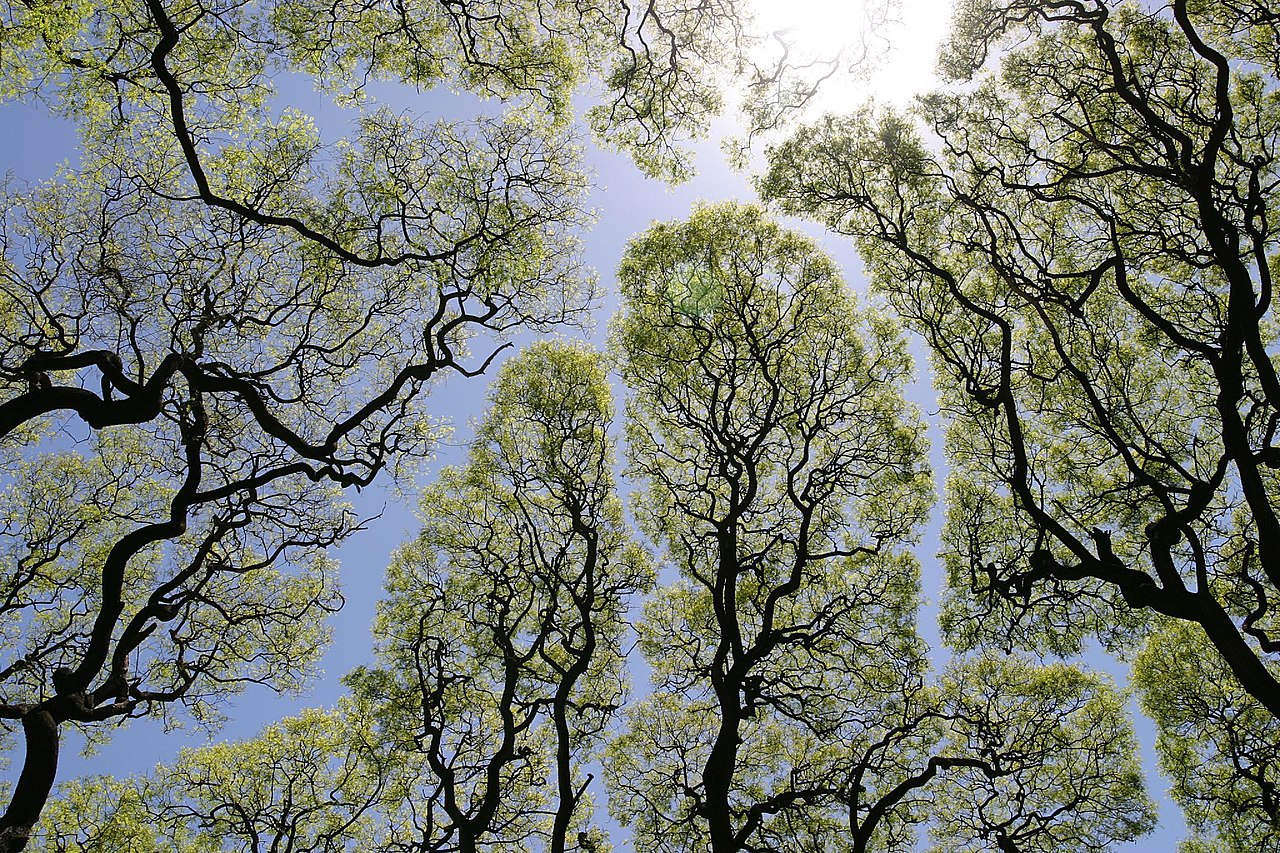
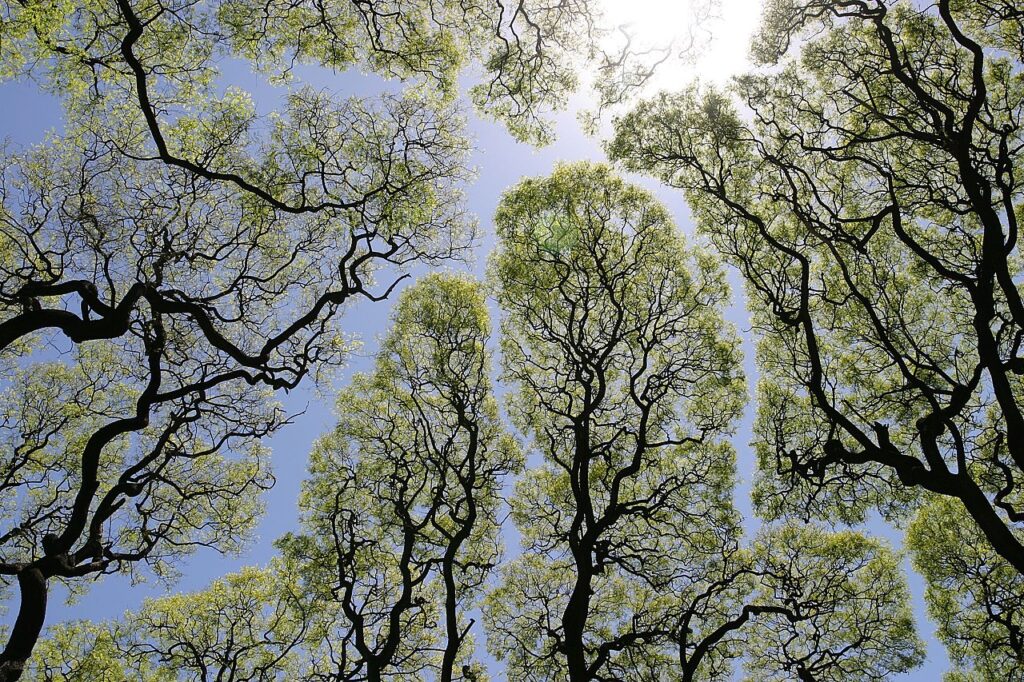
    What crown shyness looks like

    Look straight up in some forests and you see narrow rivers of sky snaking between neighbouring crowns. The leaves form blocks or islands and the gaps between them trace a clean, crack-like network that looks almost designed. This pattern is called crown shyness, and it appears when the crowns of fully stocked trees stop growing just short of one another, leaving channel-like gaps instead of a continuous canopy.1

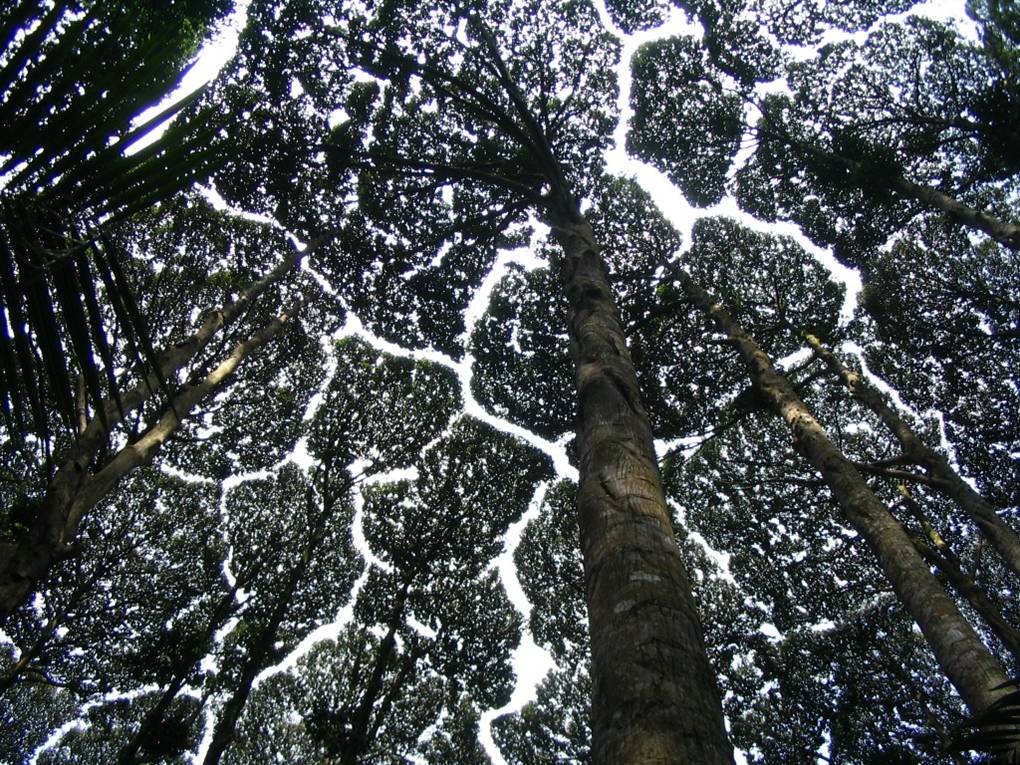
    Not every forest shows crown shyness. Where it occurs, it is usually most obvious in stands where trees are similar in height and packed closely together. Some of the best known examples involve tropical dipterocarps such as Dryobalanops aromatica in Malaysia, certain eucalypts, lodgepole pines and black mangroves, although multi-species “jigsaw” canopies also exist.1

    Crown shyness in the canopy of Dryobalanops aromatica at the Forest Research Institute Malaysia
    Crown shyness in the canopy of Dryobalanops aromatica at the Forest Research Institute Malaysia. Photo: Patrice78500 (public domain).2

    How trees keep their distance

    One of the earliest explanations focused on simple physical contact. In windy sites, adjacent crowns sway and collide. Twigs and young shoots get scraped, broken or stripped of buds at the exact points where branches would otherwise overlap. Field work in Costa Rican mangroves showed that frequent wind-driven collisions prune back the outermost shoots of neighbouring trees, leaving a lasting track of empty space between their crowns.3

    Experiments in managed stands add support to this abrasion idea. In some conifer forests, researchers physically prevented neighbouring crowns from colliding, for example by tying stems or shielding branches. Over time the canopy gaps largely closed, and crowns expanded farther sideways than in unmodified plots. In wind-exposed stands, especially where tall, slender trees of similar height share the canopy, repeated collisions keep lateral growth in check and maintain crown shyness patterns.4

    Another line of work suggests that trees avoid each other without needing to crash together first. Plants can detect nearby neighbours through changes in light quality, particularly the ratio of red to far-red wavelengths and the direction of blue light. When a leaf senses the backscattered light from another canopy, the tree can redirect growth away from that neighbour and invest more in vertical extension.5 In Malay camphor trees, for example, the growing tips appear to slow or stop as they approach the shaded edge of a neighbour’s crown, even when there is little sign of mechanical damage.

    Work in Arabidopsis thaliana adds a further twist. When this model plant grows among close relatives, it tends to place leaves to avoid shading kin, yet it is less generous with unrelated individuals. This behaviour depends on several photoreceptor systems, the same classes of sensors that mediate shade avoidance in taller trees.6 Crown shyness in some forests may therefore emerge from many individual branches following simple, light-guided rules about where not to grow.

    More recently, high resolution laser scanning of forest canopies has shown that neighbouring crowns in shy stands often fit together like complementary surfaces. Where trees are tall and slender, their crowns grow into shapes that minimise overlap with neighbours while still filling available space. The resulting canopy is neither random nor perfectly tiled, but a statistically consistent pattern of near misses.7

    Benefits of leaving sky gaps

    Crown shyness looks dramatic from below, but from the tree’s point of view it may be a compromise that improves survival. The most direct benefit is avoiding structural damage. Limiting collisions reduces broken twigs and split branches, especially in flexible, fast-growing crowns that sway strongly during storms. Less damage means less opportunity for decay fungi and other pathogens to enter through wounds, and the tree keeps more of its leaf area intact over many years.9

    The gaps also change how resources flow through the forest. Where crowns do not fully interlock, more light reaches the understory in narrow shafts and patches. That extra light can support a richer mix of shrubs, seedlings and ground plants, which in turn supports more insects and vertebrates.10 Rainfall is channelled through the open lanes, helping water reach the soil rather than being intercepted entirely by outer foliage. By moderating shade, wind and moisture, crown shyness can make a dense stand function less like a solid roof and more like a selective filter.

    Some studies and reviews argue that the gaps may slow the spread of leaf-eating insects, parasitic vines and foliar diseases, since there is less continuous contact between neighbouring crowns.8 Even small separations can reduce the chance that a caterpillar, liana or fungal infection can move directly from one tree to the next. In that sense, the “social distancing” metaphor that often accompanies popular images of crown shyness is not entirely off the mark.

    Where and when it appears

    Crown shyness is not a universal forest feature. It shows up most clearly where trees are crowded, of similar height and age, and exposed to enough wind to nudge crowns against each other. That includes dipterocarp stands in Southeast Asian rainforests, black mangroves in Central America, lodgepole pine forests in western North America and even some urban plantings of oaks and eucalypts.1

    Within a single stand, the pattern can change over time. In young, flexible canopies, branches respond quickly to abrasion or shading and gaps are often sharp. As trees age, differential growth, mortality and storm damage can blur the edges. Mixed-species forests complicate things further. Some species seem “shy” only toward their own kind, while others maintain spacing with neighbours of many species. Structure, species identity and local climate all interact to decide whether a particular forest shows the characteristic puzzle of sky or an almost continuous green ceiling.7

    What scientists still do not know

    Despite a century of observation, there is no single agreed cause for crown shyness. Long term measurements and modelling suggest that mechanical abrasion, light-guided growth and species-specific physiology all matter, but not in the same way for every forest. In some stands, preventing collisions is enough to erase the gaps, which points strongly to wind-driven pruning. In others, careful searches find little physical damage at crown edges, and light sensing provides a better fit to the data.8

    Current work uses tools such as terrestrial LiDAR, canopy robots and high resolution time series to track how individual branches move and grow in three dimensions. Those approaches are starting to tie broad patterns in the canopy back to local rules at the scale of a bud or leaf. The emerging picture is that crown shyness is not a single behaviour. It is a recurring outcome that different tree species can reach through different combinations of mechanics, sensing and competition, all shaped by the wind and light environment they share.


    References

    1. “Crown shyness” overview and species list, Wikipedia. https://en.wikipedia.org/wiki/Crown_shyness ↩︎ ↩︎ ↩︎
    2. Patrice78500. Dryobalanops aromatica canopy.jpg, Wikimedia Commons (public domain). https://commons.wikimedia.org/wiki/File:Dryobalanops_Aromatica_canopy.jpg ↩︎
    3. Putz, F. E., Parker, G. G., Archibald, R. M. “Mechanical Abrasion and Intercrown Spacing,” American Midland Naturalist 112, 24–28 (1984). https://doi.org/10.2307crown shyness/2425452 ↩︎
    4. Meng, S. X. et al. “Preventing crown collisions increases the crown cover and heterogeneity in conifer stands,” Journal of Ecology 94, 148–159 (2006). https://besjournals.onlinelibrary.wiley.com/doi/10.1111/j.1365-2745.2006.01121.x ↩︎
    5. Ng, F. S. P. and subsequent summaries on camphor trees and crown shyness, for example “Shorea resinosa: Another jigsaw puzzle in the sky,” Forest Research Institute Malaysia. https://www.frim.gov.my/shorea-resinosa-another-jigsaw-puzzle-in-the-sky/ ↩︎
    6. Crepy, M. A., Casal, J. J. “Photoreceptor-mediated kin recognition in plants,” New Phytologist 205, 329–338 (2015). https://doi.org/10.1111/nph.13040 ↩︎
    7. van der Zee, J. et al. “Understanding crown shyness from a 3-D perspective,” Annals of Botany 128, 725–738 (2021). https://academic.oup.com/aob/article/128/6/725/6170584 ↩︎ ↩︎
    8. Stallings, J. and others. “A comprehensive review of plant crown shyness,” International Journal of Botany Studies 9(10), 2024. https://www.botanyjournals.com/assets/archives/2024/vol9issue10/9112.pdf ↩︎ ↩︎
    9. Wu, K. J. “Some trees may ‘social distance’ to avoid disease,” National Geographic, 6 July 2020. https://www.nationalgeographic.com/science/article/tree-crown-shyness-forest-canopy ↩︎
    10. “Crown Shyness: When Trees Need Personal Space,” Geography Realm, 2025. https://www.geographyrealm.com/crown-shyness-when-trees-need-personal-space/ ↩︎
  • Starling murmurations: how thousands move as one

    Starling murmurations: how thousands move as one

    A starling murmuration at Hadden Farm Cottages
    A starling murmuration at Hadden Farm Cottages. Credit: Walter Baxter, CC BY-SA 2.0.

    Why the shapes form

    A starling murmuration is a pre-roost gathering where thousands of European starlings (Sturnus vulgaris) wheel and fold above a shared night roost near dusk. Small foraging groups converge, merge, and test the air before dropping to reeds, piers, or woodlands. The result is a continuous surface that stretches, curls, and compacts without breaking. Field organisations describe peak displays on cold, calm evenings in mid-winter when regional numbers swell.12

    Local rules, global order

    For years, models assumed each bird followed others within a fixed distance. High-resolution 3D reconstructions from the STARFLAG project in Rome overturned that idea. Starlings interact topologically: each bird tracks a fixed number of nearby neighbours regardless of the changing density of the flock. This single change explains how patterns remain coherent when the group stretches or compresses.34

    Winter murmuration. Short clip that shows stretching and compaction while cohesion is preserved.8

    Six neighbours, not six metres

    STARFLAG’s measurements show each starling aligns with about six to seven neighbours. The number stays roughly constant even as spacing changes, which is why structure and reaction speed hold up when the flock dilates. This topological rule outperforms metric-distance rules in preserving group cohesion under disturbance.34

    Correlations in velocity fluctuations are “scale-free” across the flock, meaning the range of mutual influence grows with flock size rather than saturating at a fixed distance. That keeps the entire group responsive to a predator or wind gust, not just a local cluster.5

    Turning waves across a flock

    When a murmuration turns, the change does not diffuse slowly. It travels as a coherent wave with little loss, so the rear birds start turning soon after the front birds, even in large flocks. Field data suggest typical cruising speeds around 7–12 m s−1, yet directional information propagates faster than an individual’s speed because it is a signal, not a body motion. This matches a symmetry-based theory that treats orientation as a conserved quantity during the turn.66

    Where to see a starling murmuration

    Look for open roost habitats such as reedbeds, piers, bridges, or groves. In the UK, numbers peak from November to February when migrants join residents. Arrive 30–45 minutes before sunset on calm, cold days. Watch for small bands streaming toward a fixed point, then condensing into a cloud above the roost. Keep distance, avoid shining lights, and stay after the main display as the late drop can be dramatic.12

    Pressures and limits

    The size and frequency of murmurations vary with weather, food, and regional populations. In some sites today, flocks reach hundreds of thousands, while historical peaks ran into the millions. Shifts in agriculture, food availability, and wintering routes influence where and when large gatherings occur. Displays can also shorten or vanish on wet and windy evenings as birds drop straight to roost.9


    References

    1. RSPB. “Starling murmurations: what, when, where.” https://www.rspb.org.uk/whats-happening/news/starlings-murmurations ↩︎ ↩︎
    2. Lancashire Wildlife Trust. “Starling murmuration facts.” https://www.lancswt.org.uk/blog/starling-murmuration-facts ↩︎ ↩︎
    3. Ballerini et al. 2008. “Interaction ruling animal collective behavior depends on topological rather than metric distance.” PNAS. PDF: https://www.pnas.org/doi/pdf/10.1073/pnas.0711437105 ↩︎ ↩︎
    4. Cavagna et al. 2008. “STARFLAG handbook / empirical study of large, naturally occurring starling flocks.” arXiv: https://arxiv.org/pdf/0802.1667 ↩︎ ↩︎
    5. Cavagna et al. 2010. “Scale-free correlations in bird flocks.” PNAS preprint: https://arxiv.org/abs/0911.4393 ↩︎
    6. Attanasi et al. 2014. “Information transfer and behavioural inertia in starling flocks.” Nature Physics. PDF: https://www.nature.com/articles/nphys3035.pdf ↩︎ ↩︎
    7. Walter Baxter (2020). “A starling murmuration at Eyemouth.” Wikimedia Commons image page: https://commons.wikimedia.org/wiki/File:A_starling_murmuration_at_Eyemouth_-_geograph.org.uk_-_6378655.jpg ↩︎
    8. “Winter Starling Murmuration | 4K | Discover Wildlife” (YouTube). https://www.youtube.com/watch?v=98ZzHACTy1Q ↩︎
    9. The Guardian. “Weatherwatch: It’s murmuration time again” (Dec 2024). https://www.theguardian.com/news/2024/dec/19/weatherwatch-its-murmuration-time-again ↩︎
  • How and why fireflies glow

    How and why fireflies glow


    Why beetles make light

    Across more than two thousand species of lampyrid beetles, light is language. Adults of many species trade precise flash patterns to find mates; larvae glow steadily. Some predators copy a rival’s code to lure victims, while bitter defensive compounds make a steady glow an honest warning. Night after night, the forest quiets and—sometimes—entire populations pulse in near perfect unison.1

    Synchronous fireflies, Great Smoky Mountains National Park.1

    A photon from chemistry

    Inside light-producing cells (photocytes), an enzyme called luciferase grips a small molecule, luciferin. First, luciferin is “primed” by ATP to make luciferyl‑AMP. Oxygen then forms a high‑energy intermediate that collapses to excited oxyluciferin—which releases a visible photon as it relaxes. The luciferase pocket and its microenvironment tune the photon’s energy, so the glow falls in the yellow‑green band our eyes sense well at dusk.2

    schematic of luciferin–luciferase reaction yielding oxyluciferin and light
    Luciferin–luciferase pathway producing light.2 Credit: Yikrazuul, CC BY‑SA 3.0.

    Nitric oxide as the switch

    Quick flashes require a quick gate. Fireflies briefly flood the lantern with oxygen by using nitric oxide (NO) to pause mitochondria’s oxygen consumption. When NO spikes, more O2 reaches luciferase and the lantern brightens; when NO falls, mitochondria reclaim O2 and the light drops. Nerve signals set the rhythm, but oxygen gating is the fast switch that makes crisp on–off pulses possible.3

    Lantern optics and color

    A reflector layer behind the photocytes is packed with uric‑acid granules that bounce photons outward, boosting brightness without extra chemistry.4 Emission color depends on luciferase and its environment; a common North American species, Photinus pyralis, peaks near 562 nm (yellow‑green).5

    From forests to the lab

    Firefly luciferases are now workhorse reporters. Engineered variants emit distinct colors so biologists can read two processes at once with a single luminometer—one of the simplest, most sensitive assays in molecular biology.6

    Can cities keep the glow?

    Habitat loss, bright night lighting, and pesticides threaten many firefly populations worldwide.7 You can help: keep outdoor lights warm‑white and shielded, use timers or motion sensors, leave patches of moist leaf litter for larvae, and avoid broad‑spectrum yard treatments.8


    References

    1. Synchronous fireflies in Great Smoky Mountains National Park — YouTube. https://www.youtube.com/watch?v=6LGGATKBda0 ↩︎ ↩︎
    2. Branchini B. Chemistry of Firefly Bioluminescence — Photobiology.info. https://photobiology.info/Branchini2.html ↩︎ ↩︎
    3. Trimmer B. A. et al. (2001) Nitric oxide and the control of firefly flashing. Science. PDF: https://www.science.org/doi/pdf/10.1126/science.1059833 ↩︎
    4. Goh K‑S. et al. (2013) Uric‑acid spherulites in the reflector layer of the firefly light organ. PLOS ONE. https://journals.plos.org/plosone/article?id=10.1371/journal.pone.0056406 ↩︎
    5. UniProt P08659 — Photinus pyralis luciferase entry (peak emission ~562 nm). https://www.uniprot.org/uniprotkb/P08659/entry ↩︎
    6. Hattori K. et al. (2018) Dual‑color firefly luciferase reporter assay. Scientific Reports. PDF: https://www.nature.com/articles/s41598-018-24278-2.pdf ↩︎
    7. Owens A. C. S., Lewis S. M. (2020) A global perspective on firefly extinction threats. BioScience. https://academic.oup.com/bioscience/article-abstract/70/2/157/5715071 ↩︎
    8. Xerces Society — Firefly‑friendly lighting practices. https://xerces.org/publications/fact-sheets/firefly-friendly-lighting ↩︎
  • How Eratosthenes Measured the Size of the Earth

    How Eratosthenes Measured the Size of the Earth

    Over 2,000 years ago, Eratosthenes calculated the size of the Earth using shadows and geometry—an experiment later memorably explained by Carl Sagan.


    Diagram showing sunlight striking Syene and Alexandria, with a 7.2° shadow angle at Alexandria.
    How a stick in Alexandria helped measure the planet (Wikimedia Commons)

    Contents


    Carl Sagan’s famous demo

    Most people first hear of Eratosthenes through Carl Sagan’s TV show Cosmos. Sagan told the story of how, more than 2,000 years ago, a librarian with a good idea, a long baseline, and some simple geometry managed to weigh the Earth—so to speak. At noon on the summer solstice, the Sun stood overhead in Syene (now Aswan, Egypt). But in Alexandria, far to the north, a stick cast a shadow. That small difference opened the door to measuring a giant sphere.1

    What Eratosthenes set up

    The trick was simple but brilliant. If sunlight is essentially parallel (a safe assumption), then the angle of a shadow at one city equals the angle of Earth’s surface between that city and another. Eratosthenes knew that in Syene, the Sun shone straight down a deep well at noon, but in Alexandria it didn’t. The angle of the shadow there was the key.2

    The key measurement

    At noon, Alexandria’s shadow gave an angle of about 7.2°. That’s one-fiftieth of a full circle. If Alexandria was one-fiftieth of the way around the world from Syene, then multiply their distance by fifty, and you get the whole circumference.3

    Where the distance came from

    Eratosthenes didn’t walk the Nile with a tape measure. Distances were already known thanks to surveyors called bematists, who measured by pacing or by wheel. From these records, the journey between Alexandria and Syene was put at about 5,000 stadia.24

    From ratio to circumference

    Multiply 5,000 stadia by 50 and you get roughly 250,000 stadia. Eratosthenes rounded to 252,000, likely because it was a neat number that divided easily in calculations. By modern reckoning, that comes tantalizingly close to Earth’s actual size.5

    What, exactly, is a “stadion”?

    A stadion was a unit of length, but not a fixed one. Different regions used slightly different versions. If we take the “Egyptian” stadion of around 155–160 m, Eratosthenes’ result comes within a few percent of the real circumference. Using a longer Greek stadion pushes the number higher. That fuzziness is why historians still argue about his accuracy.6

    How close was he?

    If the shorter stadion is right, then Eratosthenes estimated Earth’s circumference at about 39,000–40,300 km. The true polar circumference is ~40,008 km. That’s astoundingly close—especially considering the tools: shadows, distances paced along a river, and some sharp thinking.56

    Assumptions and caveats

    • Parallel rays: The Sun is far enough that its rays are essentially parallel.3
    • Same meridian: Syene and Alexandria aren’t exactly on a north–south line, and the Nile road wasn’t a perfect straight shot.24
    • Syene on the tropic: It’s close, but not a perfect alignment. Still, it was “good enough” for remarkable accuracy.2

    Try it yourself today

    You can repeat Eratosthenes’ experiment with two sticks, two cities, and a bit of coordination. Schools and astronomy clubs often do this as a group project. All it takes is noting the shadow angle at the same time and comparing distances. It’s a wonderful way to see how simple observations can reach cosmic conclusions.37


    References

    1. Carl Sagan, “Cosmos” clip explaining Eratosthenes — youtube.com/watch?v=G8cbIWMv0rI ↩︎
    2. Cleomedes, On the Circular Motions of the Celestial Bodies — 1891 Teubner edition on Internet Archive: archive.org/details/kleomedouskyklik00cleo ↩︎ ↩︎ ↩︎ ↩︎
    3. NOAA Education — “The History of Geodes: Global Positioning Tutorial” (explains Eratosthenes’ formula and assumptions): oceanservice.noaa.gov/education/tutorial_geodesy/geo02_hist.html ↩︎
    4. Heath, Thomas L., A History of Greek Mathematics, Vol. I (Oxford 1921) — Cornell scan: archive.org/details/cu31924008704219 ↩︎ ↩︎
    5. Encyclopaedia Britannica — “Eratosthenes”: britannica.com/biography/Eratosthenes ↩︎ ↩︎
    6. Roller, Duane W., Eratosthenes’ Geography (Princeton, 2010) — Google Books listing: books.google.com/…/Eratosthenes_Geography ↩︎ ↩︎
    7. “The Eratosthenes experiment: calculating the Earth’s circumference” — Science in School classroom activity (PDF): scienceinschool.org/…/Issue-63-Eratosthenes.pdf ↩︎
  • Feather Stars: Biology, Habitat, and Life Cycle of Crinoids

    Feather Stars: Biology, Habitat, and Life Cycle of Crinoids

    A rare feather star (Comatulid crinoid) swimming in open water.
    Video by Els van den Eijnden / Caters Clips on YouTube

    What Are Feather Stars?

    Feather stars are striking marine invertebrates in the class Crinoidea, related to starfish and sea urchins. As free‑living comatulid crinoids, they shed the stalk that anchors sea lilies and use claw‑like cirri to grip surfaces or swim in open water. Their name derives from the graceful, feathery arms that radiate from a central cup, which they use for both locomotion and passive filter‑feeding on plankton and organic particles.

    Anatomy and Feeding Strategy of Feather Stars

    Each feather star can have 5 to over 50 arms, which often branch into smaller “feathers” called pinnules. Along these pinnules, tube feet capture plankton and organic particles drifting by. Cilia then sweep the trapped food along slim grooves toward the mouth at the center of the cup. This passive filter‑feeding system maximises surface area for efficient nutrient capture.

    IMG_1477
    Underwater photograph by Xplore Dive on Flickr (CC BY 2.0).

    Habitat and Behavior of Feather Stars

    Feather stars inhabit a broad range of marine settings—from shallow tropical reefs and temperate seagrass meadows to the deep sea beyond 5,000 m. After metamorphosis, juveniles detach from their stalk and gain mobility. They crawl using their arms and cirri, and some species can swim short distances by rhythmically waving their arms. When at rest, they coil their arms protectively and anchor themselves in crevices or on overhangs.

    Reproduction and Life Cycle of Feather Stars

    During spawning events, adults release eggs and sperm from specialized arm structures into the water column, where fertilization happens externally. The fertilized eggs develop into free‑swimming larvae that drift with currents until they settle on the seabed. There, each larva attaches via a temporary stalk and transforms into a juvenile. Once the stalk is shed, the young crinoid becomes a mobile adult—ready to feed, move, and join the next spawning cycle.

    Further Reading

  • Pillars of Creation: A Celestial Nursery in the Eagle Nebula

    Pillars of Creation: A Celestial Nursery in the Eagle Nebula

    Eagle Nebula’s Pillars of Creation, photographed in 2014 by Hubble Space Telescope
    NASA, ESA, and the Hubble Heritage Team (STScI/AURA)

    One of the most iconic images in space photography, the Pillars of Creation are towering columns of interstellar gas and dust located in the Eagle Nebula (also known as Messier 16, M16, or NGC 6611), about 6,500–7,000 light-years from Earth in the constellation Serpens. These vast structures, as much as several light-years tall, are active regions of star formation.

    The pillars consist mainly of cool molecular hydrogen and dust, which absorb visible light, making them appear dark and opaque in optical wavelengths. At their tips, denser clumps of gas—known as evaporating gaseous globules (EGGs)—shield material behind them and are often sites where protostars are forming. The UV radiation from nearby hot stars gradually erodes the pillars, a process known as photoevaporation, which both reveals and influences star formation within.

    The origin of using the name “Pillars of Creation” for these structures is not entirely clear. The phrase “Pillars of Creation” can be traced to a sermon by 19th-century Baptist preacher Charles Spurgeon, with its first use in relation to the Eagle Nebula occurring at a November 1995 press conference by NASA to promote the recently captured Hubble Space Telescope images.

    In 2022, NASA released a new image of the Pillars captured by the James Webb Space Telescope using near-infrared wavelengths. This view revealed thousands of previously hidden newborn stars glowing within the columns, as infrared light can penetrate dense clouds of dust that obscure visible light.

    Pillars of Creation in the Eagle Nebula in near- and mid-infrared by the James Webb Space Telescope.
    NASA, ESA, CSA, STScI, J. DePasquale, A. Pagan, A. M. Koekemoer

    Though the pillars appear serene, astronomers believe they may have already been disrupted by a supernova that occurred thousands of years ago, the light of which has not yet reached Earth. The original structures we see today may already be gone, making the Pillars of Creation a snapshot of a fleeting cosmic moment frozen in light traveling across space and time.

    Zoom into the Eagle Nebula, transitioning from ground-based imagery to Hubble’s Pillars of Creation.
    NASA, ESA/Hubble, and the Hubble Heritage Team

    Learn more:

  • Queen of the Night: A Cactus That Blooms Only at Night

    Queen of the Night: A Cactus That Blooms Only at Night

    Epiphyllum oxypetalum “Queen of the Night” in bloom.
    Credit: P. Karpiński, CC BY-SA 3.0

    Epiphyllum oxypetalum, commonly called the Queen of the Night, is a species of cactus best known for its large, fragrant white flowers that bloom exclusively at night.

    Unlike most cacti, which grow in arid environments, it is native to tropical forests in Mexico, Central America, and parts of South America, where it grows epiphytically—anchored to trees rather than rooted in soil.

    The plant has long, flat, leaf-like stems and prefers humid, shaded environments. It uses its stems to absorb moisture and indirect light, allowing it to thrive high in the forest canopy. While classified as a cactus, it lacks spines and tolerates more moisture than desert-adapted species.

    Its flowers, often up to 25–30 cm across, open after sunset and wither before sunrise. They release a strong, sweet fragrance during their brief bloom, likely to attract night-flying pollinators such as moths. Each individual flower blooms only once, usually in summer or early autumn, although mature plants can produce multiple blooms across a season.

    Because flowering is unpredictable and happens at night, catching the event often requires careful observation of buds and some late-night vigilance. Despite its fleeting nature, the bloom is widely celebrated for its beauty and scent, making Epiphyllum oxypetalum a prized ornamental plant in many tropical and subtropical gardens.

    Time-lapse of Epiphyllum oxypetalum blooming overnight.
    Credit: Grant Nielsen, CC BY 3.0

    Learn more:

  • Ferrofluid: The Liquid That Dances to Magnetism

    Ferrofluid: The Liquid That Dances to Magnetism

    Ferrofluid on glass with a neodymium magnet underneath.
    Photo by Gregory F. Maxwell, CC BY-SA 3.0

    Ferrofluid is a striking substance that behaves like a liquid yet reacts dramatically to magnetic fields. Composed of nanoscale ferromagnetic particles suspended in a carrier fluid (often oil or water), ferrofluid becomes magnetized in the presence of a magnetic field. This results in a mesmerizing display of spikes and patterns that align with the field’s lines of force. Originally developed by NASA in the 1960s for use in zero-gravity fuel systems, its unique properties have since found a wide range of applications.

    What makes ferrofluid particularly fascinating is its blend of solid and liquid behavior. When no magnetic field is present, it flows freely like any other liquid. But when exposed to a magnet, it stiffens and forms sharp, structured peaks. These formations are the result of the magnetic particles aligning with the field, creating visible contours of invisible forces. This responsiveness gives it both scientific and artistic value, captivating researchers and designers alike.

    In practical terms, ferrofluid is used in various industries, including electronics, medicine, and mechanical engineering. It’s commonly used to seal rotating shafts in hard drives and other equipment where dust contamination must be minimized. It also plays a role in targeted drug delivery systems and as a contrast agent in certain types of medical imaging. Its ability to convert magnetic energy into mechanical motion has also opened experimental avenues in robotics and soft actuators.

    Beyond its technical uses, ferrofluid has gained popularity as a visual and educational tool. Science centers and classrooms often feature ferrofluid to demonstrate magnetic fields in a vivid, hands-on way. Artists and designers have also explored its aesthetic appeal in kinetic sculptures and installations. Its hypnotic motion and responsiveness continue to make ferrofluid a compelling intersection of physics, chemistry, and visual wonder.

    Learn more:

  • What Is Dirty Lightning? The Volcanic Phenomenon Behind Electrified Ash Clouds

    What Is Dirty Lightning? The Volcanic Phenomenon Behind Electrified Ash Clouds

    Dirty lightning is a rare and visually striking phenomenon that occurs during volcanic eruptions. Unlike regular lightning that forms in thunderstorms, dirty lightning originates within a volcanic ash plume. As an eruption ejects ash, rock fragments, and gas into the atmosphere, the particles collide and generate static electricity. This separation of electrical charge can trigger lightning bolts within or around the ash cloud.

    The mechanism behind dirty lightning is similar to thunderstorm lightning in that it involves charge buildup and discharge. However, instead of water droplets or ice, the charge in dirty lightning comes from volcanic ash and debris. High particle density, turbulent updrafts, and the physical properties of the ash all contribute to the frequency and intensity of the lightning. Notable examples include the 2009 eruption of Mount Redoubt in Alaska and the 2010 eruption of Eyjafjallajökull in Iceland, both of which produced highly active dirty lightning displays.

    A powerful nighttime volcanic eruption at Eyjafjallajökull in Iceland, showing a massive ash plume illuminated by glowing lava and multiple visible lightning strikes within the dark cloud, with snow-covered ground in the foreground.
    Volcanic lightning during the 2010 Eyjafjallajökull eruption, photographed by Terje Sørgjerd. Licensed under CC BY-SA 3.0.

    Scientists study dirty lightning to gain insight into eruption dynamics and plume development. Because lightning can be detected remotely and in real time, it serves as a valuable tool for monitoring volcanic activity—especially when direct visual observation is not possible. This information is critical for aviation safety, as volcanic ash clouds can severely damage aircraft engines and systems.

    Dirty lightning, while dramatic in appearance, is a natural consequence of explosive volcanic processes. It offers a glimpse into the immense energy involved in eruptions and serves as a warning of potentially hazardous ash plumes that may not be immediately visible from the ground.

    Learn more:

  • Rainbows Are Full Circles, Not Arcs

    Rainbows Are Full Circles, Not Arcs

    Most people think of rainbows as colorful arcs stretching across the sky, but in reality, rainbows are full circles. The ground usually blocks the lower half from view, which is why we typically only see a semi-circular shape. However, if you’re at a high elevation with the right lighting, such as in an airplane, you can sometimes see the full circular rainbow.

    Rainbows form when sunlight is refracted, reflected, and dispersed inside water droplets in the atmosphere. The light enters each droplet, bends, reflects off the back, and then bends again as it exits. This process directs light back toward the observer at a fixed angle, about 42 degrees from the direction opposite the sun. The circle is centered on this “anti-solar point,” and the complete rainbow exists around it.

    Because the Earth’s surface gets in the way when viewed from the ground, we only see the upper portion of the circle. The higher you go, the more of the circle becomes visible. Pilots and mountain climbers occasionally report seeing full-circle rainbows, especially when the sun is low and behind them.

    Learn more: